
A Funnel With Honest Drop Off
I’ve spent eleven years watching small business owners get sold expensive, bloated software packages that promise to revolutionize their sales process, only to end up staring at a dashboard they don’t understand. Most “experts” will tell you that learning how to build a funnel report requires a data science degree or a monthly subscription to some shiny enterprise platform. They’ll show you complex, multi-layered diagrams that look more like a plumbing schematic than a business tool. Honestly? It’s a scam. If you can’t see exactly where your money is leaking by looking at a single page, you aren’t “optimizing”—you’re just wasting time.
I’m not here to sell you on a complicated framework or a 40-slide deck. My promise is simple: I am going to show you how to build a report that actually tells you something useful, using nothing more than the tools you already have. We are going to strip away the jargon and focus on the only numbers that matter to a solo founder. By the time we’re done, you’ll have a working system that you can set up in a single afternoon, leaving you plenty of time to actually run your business.
Mapping Your Customer Acquisition Funnel Stages Fast

Stop trying to create a complex user journey visualization that looks like a NASA flight path. You don’t need a 20-step map to understand why people aren’t buying. Most small firms drown in data because they try to track every single click, a mistake I see constantly. Instead, strip your customer acquisition funnel stages down to the bare essentials: Awareness, Interest, and Action. If you can’t name the stage in one word, it’s too complicated for a solo operator to track effectively.
To do this quickly, look at your actual transaction history and your website traffic. Don’t guess. Grab your last three months of data and identify the three most obvious transition points. Are they seeing an ad? Are they landing on a specific product page? Are they hitting the “checkout” button? That is your map. By identifying friction points in sales funnel transitions at this high level, you aren’t wasting hours on granular fluff; you are pinpointing exactly where the money is leaking out of your business. Keep it lean, keep it moving, and get back to work.
Essential Data Visualization for Marketing Funnels Without the Fluff
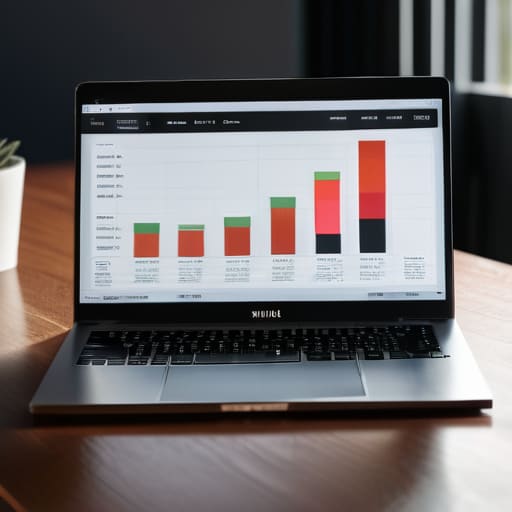
Look, I don’t care about fancy, interactive dashboards that require a data science degree to navigate. If you’re staring at a screen full of moving parts, you aren’t actually analyzing anything; you’re just being distracted by shiny objects. For a solo operator, effective data visualization for marketing funnels boils down to one thing: seeing exactly where the money is leaking. You need a simple bar chart or a basic line graph that shows your volume at each stage. If the bars get significantly shorter between “Website Visit” and “Inquiry,” you’ve found your problem.
Forget the complex user journey visualization software that promises to map every single click. It’s a waste of your Tuesday. Instead, focus on identifying friction points in sales funnel stages by looking at the raw drop-off numbers. I want to see the delta between Step A and Step B. If you can’t see the gap clearly on a single sheet of paper or a basic spreadsheet, the visualization is too complicated. Keep your metrics lean, keep your charts clean, and get back to actually talking to your customers.
5 Ways to Stop Wasting Time on Reports That Don't Work
- Stop chasing every single metric. Pick three: how many people saw you, how many clicked, and how many actually paid. If you can’t track it in a single spreadsheet, it’s noise.
- Ditch the fancy dashboard software. Most of you don’t have the hours to manage a subscription for a tool you’ll only use once a month. A Google Sheet is faster, cheaper, and actually works.
- Look for the “leaks,” not just the wins. I don’t care if your top-of-funnel traffic is huge if nobody is moving to the next step. Find the stage where the numbers drop off a cliff and fix that first.
- Set a timer for sixty minutes. If you can’t pull your numbers and spot a trend in an hour, your reporting process is too heavy. Simplify your data sources until it’s a quick win.
- Compare this week to last week, not to some theoretical “industry benchmark.” Benchmarks are for enterprise firms with massive budgets; you just need to know if you’re doing better than you were last Tuesday.
The Afternoon Audit: Three Rules to Live By
Stop chasing “comprehensive” datasets; if you can’t extract the numbers and see the trend in a single spreadsheet by 4 PM, you’re wasting time on vanity metrics that don’t pay the bills.
Focus on the friction points, not the whole journey; identify exactly where people are dropping off and fix that one leak before you worry about optimizing the rest of the path.
Ditch the fancy dashboards; a simple table showing your conversion rates from one stage to the next is more useful for a solo founder than a high-end visualization that takes three days to build.
Stop Overthinking the Math

Look, we’ve covered the ground. You’ve mapped your stages without getting lost in the weeds, and you’ve identified the only three or four metrics that actually matter to your bank account. You don’t need a dashboard that looks like a NASA control room or a $500-a-month software subscription to see where your leads are dropping off. All you need is a simple spreadsheet, your raw data, and the discipline to look at the numbers once a week. If you can’t see the bottleneck in under ten minutes, your report is too complicated. Stick to the essential data points and ignore the rest of the noise.
My biggest fear for small business owners is that they’ll spend more time “optimizing the reporting process” than actually talking to customers. Don’t let the pursuit of a perfect report become a procrastination tool. A messy, imperfect spreadsheet that tells you your conversion rate dropped by 5% is infinitely more valuable than a beautiful, automated dashboard that you never actually open. Get your report built this afternoon, find the leak, and then get back to the work that actually grows your business. Done is better than perfect.
Frequently Asked Questions
What if my business doesn't have enough monthly traffic to make these numbers look meaningful?
Stop obsessing over percentages. If you only have 40 visitors a month, a “2% conversion rate” is just a rounding error that tells you nothing. Instead, switch to raw numbers and look for patterns. Are those 40 people actually the right people? Forget the fancy conversion math for now. Focus on the qualitative stuff: what questions are they asking? If the volume is low, your goal isn’t statistical significance; it’s finding the signal in the noise.
How often do I actually need to update this report without it eating up my entire week?
If you’re doing this daily, you’re wasting time. If you’re doing it quarterly, you’re flying blind. Aim for once a month. Set a recurring calendar invite for the first Monday of the month. Spend ninety minutes pulling your numbers, spotting the obvious leaks, and noting what to tweak. Anything more than that isn’t “data-driven decision making”—it’s procrastination disguised as productivity. Get in, get the numbers, and get back to actually running your business.
Which specific metrics should I ignore so I don't get distracted by "vanity" data?
Stop obsessing over likes, shares, and follower counts. They feel good, but they don’t pay the rent. If a metric doesn’t tell you exactly how many people moved from “just looking” to “actually paying,” it’s just noise. I’ve seen too many founders waste hours analyzing engagement rates on a post that didn’t drive a single lead. If you can’t link a number directly to your bank balance or your pipeline, ignore it.
I don't have a fancy CRM; can I actually build a decent report using just a basic spreadsheet?
Yes. In fact, I’d prefer you did. Most CRMs are just expensive, over-engineered spreadsheets that nobody actually uses correctly. If you can track your leads in a simple row and column, you can build a report. Grab your data, dump it into Excel or Google Sheets, and calculate your conversion rates between stages. If it takes you more than two hours to set up, you’re overthinking it. Keep it lean.
